
The summer doldrums may be over early.
The stock market appears to have broken out of its rangebound price action at the beginning of August, and unfortunately, it doesn’t look like it is going in a positive direction.
Instead, the market action suggests the potential for a new trading environment highlighted by increased volatility. In short, traders should be on alert for further signs of potential downside.
💵💰Don’t miss the move: Subscribe to TheStreet’s free daily newsletter💰💵
“Volatility” is a loaded word; when most mention it, they mean negative or downside volatility. (Most folks don’t mind when price spikes are higher, right?)
Friday’s weak jobs numbers appear to have significantly rearranged the pieces on the proverbial trading board—particularly worrisome given the likely growth-impeding Trump tariffs set to take effect August 7.
A week ago, everything was peachy-keen, pointing to a steady-as-she-goes Fed interest rate policy going into the September 17-18 FOMC meeting. As of July 31, the odds of a Fed rate change in September were 60% in favor of no change, about where it has been over the prior few weeks.
Now, that’s changed– significantly.
 The stock market may get hit by higher volatility in August.
Image source: Michael M. Santiago/Getty Images
Stock market volatility may crush complacency
The odds that interest rates would stay the same may have been priced into stocks, given that major market indices climbed to new all-time highs last week.
However, Friday’s Bureau of Labor Statistics jobs report may have changed everything. It showed anemic July job growth of only 73,000 versus expectations of 110,000.
Related: Major Wall Street analyst revamps S&P 500 target amid tumble
Worse, revisions to May and June erased over a quarter million jobs, painting a much weaker picture of the US labor situation than previously recognized.
After the jobs data was released, the market did an about-face, concluding that instead of no cuts, the Fed would lower rates by a quarter percent in September and potentially reduce them even more before the end of the year.
According to futures data on August 1, CME Fed Fund Futures priced in a 76% chance of a 0.25% Fed rate cut in September, with a total of 0.62% in cuts expected by the December FOMC meeting.
Increased chances of a rate cut would usually be good news for stocks, because it would mean more economic activity, higher revenue, and bigger profits.
This time around, however, cuts would be for all the wrong reasons: tariff uncertainty, job market weakness, fear of a US or global recession/slowdown, not to mention the undermining of the Fed’s independence and the credibility of the BLS data, all contributing to a bleak outlook for the US in second half of 2025.
After the jobs data revisions, President Trump fired BLS commissioner Erika McEntarfer in frustration.
Friday’s jobs data is a major market wake-up call
Friday’s data questions the overall strength of the US economy, and markets were not pleased.
Related: Jobs report shocker resets Fed interest rate cut bets
The S&P 500 index lost 1.6% on Friday while other major indices slipped as well (NASDAQ down 2.2%), and crude oil dropped 2.9% on fears of a US and broader global slowdown.
These recent developments represent a significant fundamental shift over mere hours and are likely not nearly fully priced into stocks. That may mean some near-term pain for investors. For those with some dry ammo (cash on the sidelines), the weeks ahead could offer discount buying opportunities.
Stock charts don’t look good
Technical analysis charts historical prices to gain insight into what may happen next. Unfortunately, the following charts paint a significant and similar technical picture, one of downside risk momentum increasing and looking poised to plumb further depths.
More Wall Street Analysts:
- Veteran analyst drops surprise call on Tesla ahead of earnings
- Best Buy analyst, focused on earnings growth, reworks stock price target
- Microsoft analysts reboot stock price targets ahead of Q4 earnings
First up is the MSCI All-World Developed Index (ACWI), an index of all major developed economies’ stock markets. It shows a sharp gap lower on Friday with a bearish crossover of the Kijun (red) line by the Tenkan (blue) line appearing to be imminent, which would be another bearish signal. The top of the cloud at 124.89, some 3.2% lower than current levels, is the next key source of Ichimoku support.
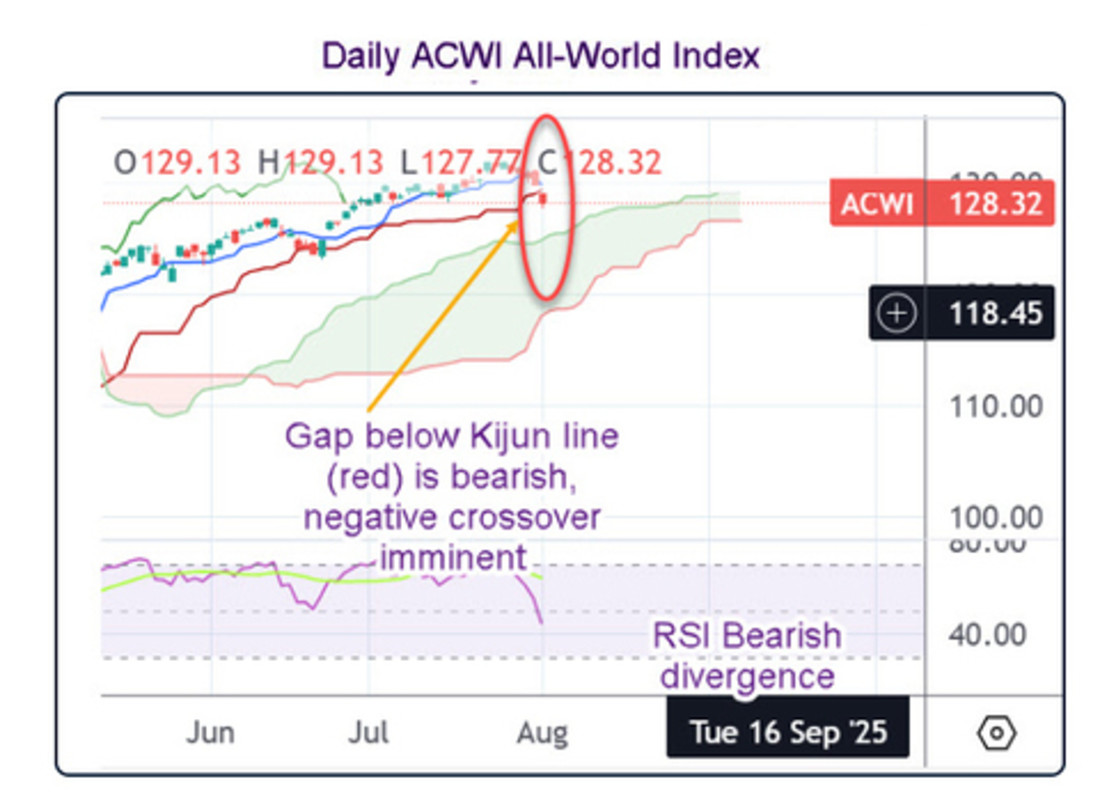 The ACWI All-World Index price chart shows signs of bearishness.
TradingView/TheStreet/Brian Dolan
Then, there’s US stocks alone as shown below by the Daily S&P 500 Index. The SPDR S&P 500 ETF Trust’s (SPY) price has gapped below the Tenkan and Kijun lines, which are also set to cross over bearishly shortly. The top of the cloud, currently at 598 and rising slightly, is the next major source of Ichimoku support, below which may signal even steeper losses toward the bottom of the cloud (light red line) at the 560 level.
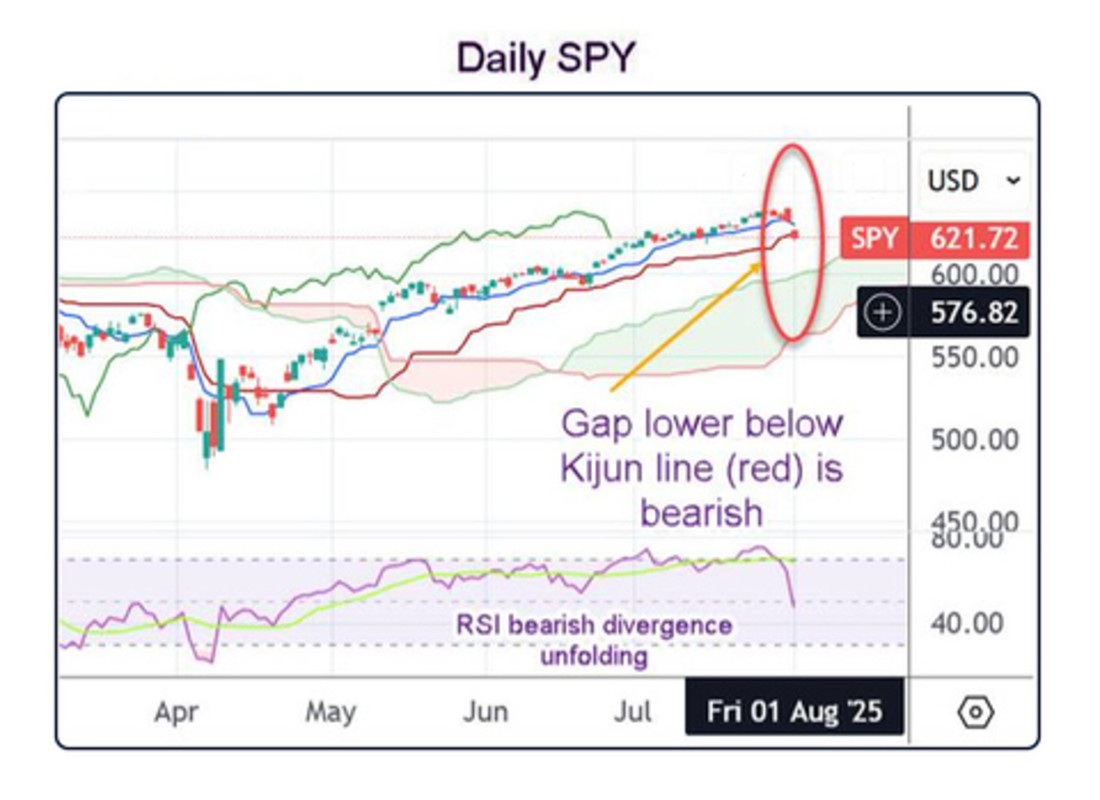 The daily price chart for the SPDR S&P 500 ETF Trust suggests lower prices.
TradingView/TheStreet/Brian Dolan
As a sign of energy demand and a proxy for global growth, the price of crude oil (WTI) is frequently a leading indicator for major risk and growth assets, including stocks and commodities.
Its chart also shows a bearish gap lower in Friday’s price action, with a daily close below the red Kijun line, but so far holding above the cloud base at $66.85. A daily close below that level will be very bearish for oil prices and the overall outlook.
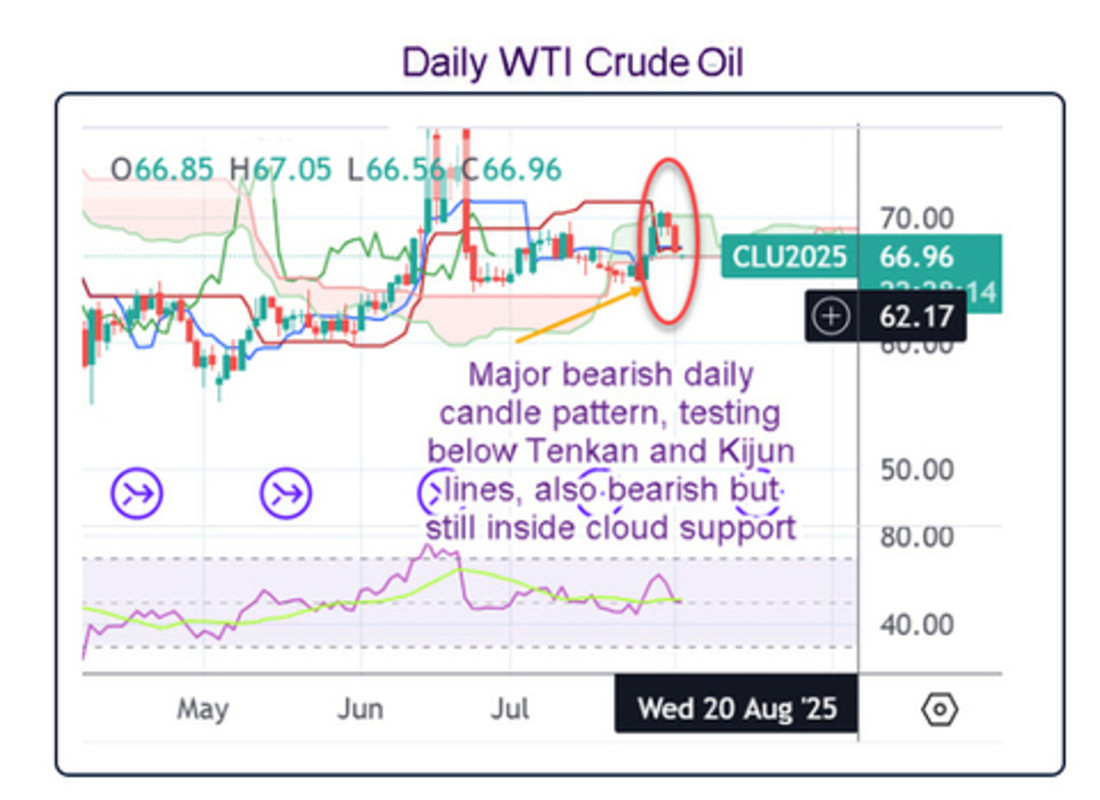 The daily West Texas Intermediate crude oil price chart suggests lower prices on a close below $66.85.
TradingView/TheStreet/Brian Dolan
What all this means for investors now
The overall picture that emerges is one of potential downside, barring any sudden reversals by the US administration on tariffs or other policies. However, a policy reversal seems less likely this time around in light of the administration’s efforts to formally impose tariffs, which starts on August 7.
If so, the TACO trade (Trump Always Chickens Out) may be a thing of the past.
As a result, investors may have to sit through some tough days in the weeks ahead, especially if the weakness suggested by price charts bears out. For those long stocks at the top, the temptation to take profit or limit losses may be another catalyst for selling if stocks continue to fall.
The real test will be whether buy-on-the-dip investors are still out there or have second thoughts this time around. Regardless, forewarned is forearmed.
Related: JPMorgan drops 3-word verdict on Amazon stock post-earnings