For the past few weeks, a word that rarely crosses investors’ lips has been regularly repeated.
Bubble.
That’s bubble as in: Stocks, especially tech stocks, have climbed so far so fast that their prices are beyond rational thinking and might be about to slump.
Former Microsoft Chief Executive Bill Gates mentioned it recently. Doug Kass of TheStreet Pro has been making the same claim for weeks. Check his post: This Market’s So Full of It,
Many money managers have used the bubble word but then reflexively said something like “not gonna happen.” A few have had the guts to say, “Not even possible.”
That’s hard on the small investor, who doesn’t have access to the ginormous banks of computers at the disposal of money managers and mutual fund companies plus their research staffs. Add in all the brokers trying to sell investments to the public.
So, we’ll try to try to answer three questions:
- Is the U.S. stock market in a bubble?
- When will the bubble pop?
- How will we know the pop has arrived?
Are stocks in a bubble?
Many people are talking about it. Berkshire Hathaway is SELLING stocks. Is Warren Buffett worried in advance of his retirement on Dec. 31? Or is it merely because Berkshire’s (BRK.A) (BRK.B) working philosophy is to avoid buying high, keeping risk at bay?
If you look at only the year-to-date numbers, the answer to the bubble question would be “No.” The Standard & Poor’s 500 Index is up 15.5% this year, the Dow Jones Industrials are up 11.2% and the Nasdaq Composite is up 21.7%. They’re fine numbers on the year, but consider that in 1999 the Nasdaq jumped 85%. THAT was a bubble.
At the same time, if you look at what’s happened since the post-Trump-tariff-announcement low on April 7, well, you be the judge:
- S&P 500 up 41%.
- Nasdaq up 58.95%.
- Nasdaq-100 up 54.9%
- Dow industrials up 29.2%.
- Russell 2000 small caps up 42.2%.
And we’ve got nearly two months to go for the year.
Judging by those measures and having lived through the dot-com bubble and its aftermath, I think bubble is a reasonably accurate description.
If we’re in a bubble, when does it pop?
To start, let us note that market bubbles don’t just explode. Rather, the market peaks and fades, and the fade turns into something worse.
The Dow, for example, closed at an all-time high of 2,722.42 on Aug. 25, 1987. It fell 17.4% from then until Oct. 16, 1987. On Monday, Oct. 19, the index crashed, falling 22.6% in one day. And since then the Dow has never even approached that day’s close: 1,738.74. It closed Nov. 5 at 47,436, or 17 times that low.
The dot-com bust, likewise, started pretty quietly. One can reasonably date the top of that bubble as March 10, 2000, when the Nasdaq closed at a record 5,048.62, up a grand total of 1.76 points from the day before.
The Nasdaq fell 141 points on March 11, 2001, and 201 points the day after that, and 124 points a day later. The index kept dropping until fall 2003, crashed again in 2008-09, and would not cross 5,000 again until spring 2015. It finished Nov. 5 at 23,500.
Bottom line: It’s next to impossible to time a market’s rise to a peak or fall to a bottom. It’s thus important to diversify your investments to ensure that if we do see an extended downturn in one segment or more broadly, your entire portfolio doesn’t get hammered.
When is it clear that losses might extend?
So, here are a few numbers to watch and use as guides and where to find them. We hope they will give you some extra ammo the next time you think a bubble could threaten your investments or you need to consider new ones.
To start, here’s how October ended.
- S&P 500 Index, up 2.3% in October and 16.3% on the year. Up 42% since the April slump.
- Nasdaq Composite Index, up 4.7% for the month and 22.9% for the year. Up 60.5% from the April low.
- Dow Jones Industrial Average, up 2.5% for the month and 11.8% in 2025. Up 29.9% from the April low.
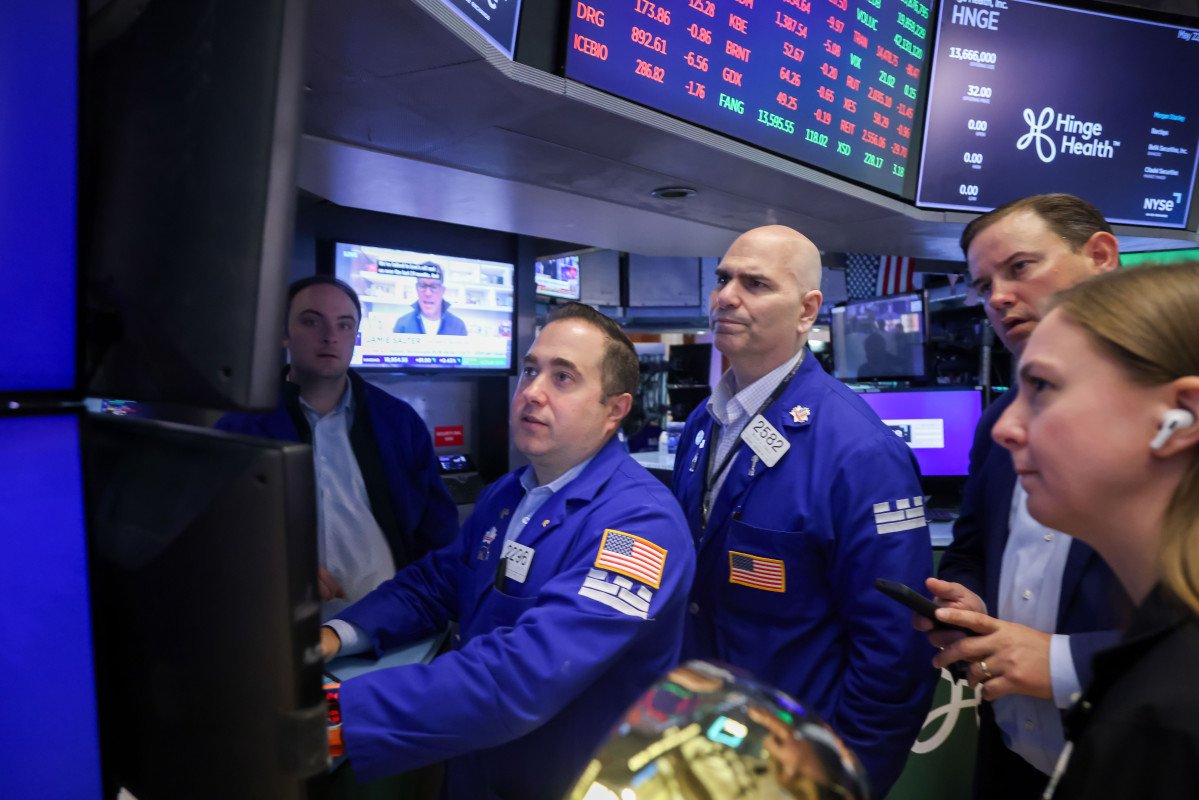 Traders working on the New York Stock Exchange in May.
Price-earnings multiples
This is possibly the easiest way to value a stock. You simply divide the stock price (or even an index price) by the earnings.
You can look at the trailing earnings multiple — divide the current stock price by the earnings from the prior 12 months.
But stock analysts also estimate what a company’s earnings will be over the following 12 months and use those to estimate the so-called forward p/e multiple. This is more important. You can find p/e multiples on our site by joining Tip Ranks. Other sites, such as Yahoo Finance, MarketWatch, Ycharts and Multpl.com, also publish them.
The S&P 500 p/e multiple hit around 30 last week. That means you’re paying $30 for every dollar of a company’s earnings. The multiple fell to 22 by Wednesday. The long-term average is 20 or lower.
The highest S&P 500 p/e multiple to start a year was 70.91 in 2009, but that was during the Great Recession. It reflected speculators who were buying stocks and expecting the worst downturn in years to bottom soon. It did, on March 9, 2009.
An important caveat: A single-digit p-e multiple might make you think you’ve found a deal, what Wall Street calls a cheap stock. What it might really be doing is telling you to do some homework on the stock.
Tesla‘s forward p/e multiple on Wednesday was about 144, reflecting Wall Street’s excitement over what emerges from Elon Musk’s mind. Nvidia‘s was 48.2. The AI-chip maker’s extraordinary growth in the past 10 years has pushed its market capitalization above $5 trillion.
VIX: the Fear Index
VIX is the nickname for the CBOE Volatility Index. This is widely watched because it is based on the S&P 500 Index, a braod measure of the stock market. When the VIX is climbing quickly, it means traders are expecting the market to drop and are buying options to protect their holdings. Hence the VIX’s other nickname: the Fear Index.
In mid-February, President Trump was making loud pronouncements about a new tariff regime ahead, and the VIX Index jumped 58% in two weeks. Just before the April 4 tariff reveal, the VIX tripled (up 205%) in just days as demand for that protection soared.
If you’re getting skittish about your investments, check the VIX. Because it carries so much weight with investors, it’s listed on major sites.
Relative-strength index
This measure looks at a stock or index price and its changes over time, typically 14 trading days. The higher the RSI, the pricier the stock and, potentially, the more vulnerable it might prove to be.
An RSI level above 70 is a signal that a stock, index or exchange-traded fund might be overbought. At 80, it IS overbought and more likely to fall than not. Likewise, a reading under 30 means a stock is oversold and might be close to a bottom.
Alphabet on Friday had an RSI of 77. Amazon.com, despite boffo earnings and a 9.6% gain on the day, was showing an RSI of 67.04.
Meta Platforms saw its RSI drop to 27 on Friday as the stock fell to $648.35 and was off 12.2% on the week.
Related: Palantir could be staring at a big problem
In early October 2023, speculators sensed the Federal Reserve was probably going to cut interest rates later in the fall. When the S&P 500 Index’s RSI dropped under 30, they began to buy heavily. Later that month, the Fed announced the policy change. The index is up 64% since.
You can find this among a large suite of indicators on Yahoo, The Wall Street Journal, Tipranks.com, MarketWatch, WallStreetNumbers.com and other sites.
Watch — or buy into — a short ETF
Some exchange-traded funds bet against the market. These are meant largely for professional investors or money managers who are seeking to manage the risk in their portfolios.
For small investors, it’s best to study how these ETFs trade. You can make a lot of money — or save a lot of money — from the Pro Shares Short S&P 500 ETF, but only if the market is falling apart. As soon as the market bottoms, the ETF falls back in a hurry.
Look at the chart of this ETF for 2025. It starts to rise rapidly from about 41 in mid-February and peaks at above 50. It started falling quickly when the market bottomed in April and now is around $36.
An acknowledgement: No indicator is perfect. So, study them carefully to see whether their results produce useful insights for you on a regular and reasonably accurate basis.
The process of using them or studying them might also lead you to other indicators that you find will do more for your investments.
Related: ACA open enrollment 2026: What to know before choosing a health plan