
Existing-home sales make up about 90% of home sales, writes the National Association of Realtors. Data about existing-home sales gives Americans insights into the U.S. housing market, including trends surrounding pricing, buying, and selling activity.
Monthly existing-home sales decreased by 1.7% in July, according to the NAR — but rose 0.7% year over year.
“Home sales have been remarkably stable, even amid the rising mortgage rate environment of the past few months,” NAR chief economist Lawrence Yun said in a statement.
So, is this steadiness good or bad news?
I reached out to the NAR to ask whether July’s existing-home sales are a sign of a stable market — or a frozen one?
“A more normal level would be around 5 million existing-home sales, compared with the current pace of about 4 million,” Yun told me. “Transactions are still happening, but sales are neither meaningfully rising nor falling.”
The housing market is far from where it should be. But considering that mortgage rates increased throughout July, the market could be much worse.
Why high mortgage rates didn’t crush existing-home sales
Mortgage rates held at over 6.5% in July. The National Association of Realtors noted that the average 30-year fixed mortgage rate was 6.54% in July, according to Freddie Mac data.
The housing market is struggling, but it’s a bit surprising that existing-home sales weren’t worse in July. Especially since current mortgage rates are higher than many Americans had expected at the beginning of 2026.
“Many eager buyers are no longer waiting on the sidelines, as they don’t expect mortgage rates to decline in any meaningful way and don’t want to risk being priced out,” Yun told me.
Related: Zillow warns 2026 housing market has officially peaked
The 6.54% FRM average is 0.05% higher than June. However, it’s actually a decrease from July 2025, when the average was 6.72%.
This could be a major reason why homebuyers were more active than one might have expected in July. Compared to this time last year, mortgage rates have actually improved.
“Still, lower mortgage rates are needed to help more potential homebuyers qualify,” Yun said.
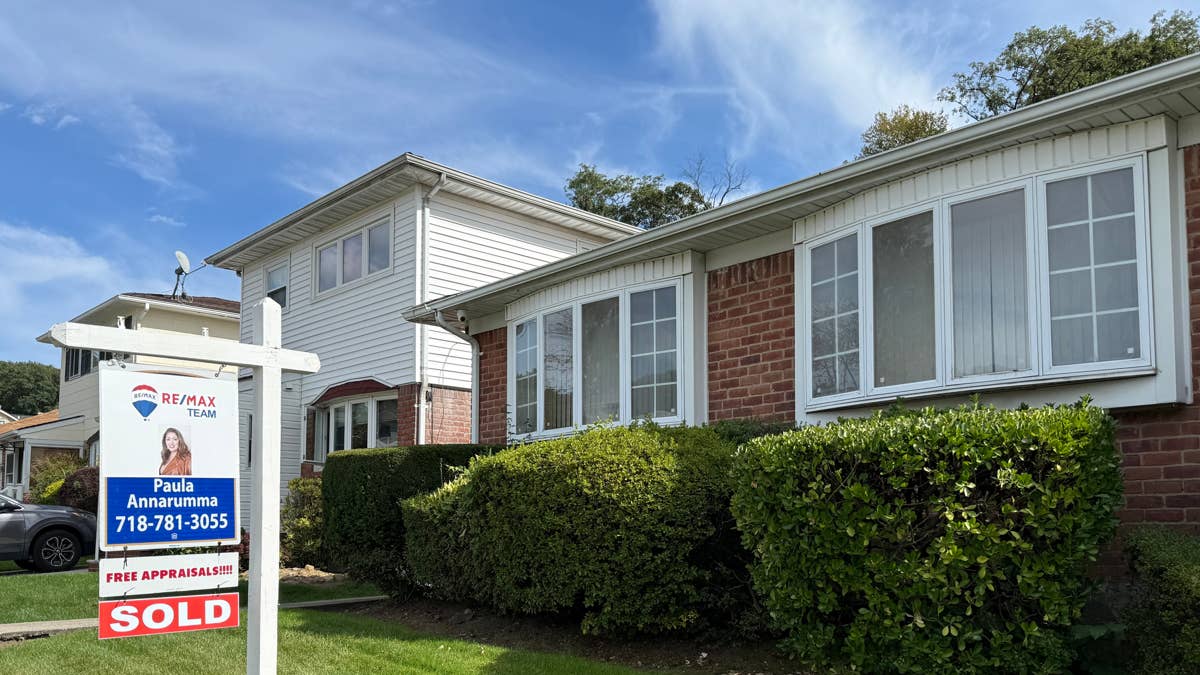 Existing-home sales data is crucial for understanding how the housing market is performing.
‘It’s all about mortgage rates:’ What’s next for the housing market
What needs to happen for the U.S. to get on track for 5 million existing-home sales in 2026 rather than the current pace of 4 million?
“In the short term, it’s all about mortgage rates,” Yun told me.
So far, Freddie Mac mortgage rates have only gotten higher in August. The 30-year fixed mortgage rate increased three basis points to 6.69% on Aug. 6.
But that could soon change.
On Aug. 12, the average 30-year FRM was 6.74%, according to Mortgage News Daily (MND), a 0.05% decrease from the previous day. This was also the lowest MND rate in the last three weeks.
MND published it several hours after the Bureau of Labor Statistics released the July Consumer Price Index (CPI).
More Mortgage Rates:
- Zillow predicts major mortgage rate, housing market change
- Americans face 3 major takeaways after mortgage rate news
- Mortgage rate forecast resets after Fed decision
“CPI is one of the two big inflation reports on any given month (the other being PCE) and it has more potential to cause a reaction because it comes out 2 weeks before PCE,” wrote Matthew Graham for MND.
Year-over-year core inflation increased 2.5%, according to the July CPI. This was in line with economists’ expectations. It was also lower than the 2.6% core inflation rate for June and the 2.9% rate for May.
“There was no additional improvement in bonds after the data, but arguably a fair amount of improvement in anticipation of just such a result,” Graham wrote.
The July inflation data could help mortgage rates decline slightly in August — which would also boost home sales.
“Anything that brings down inflationary pressures will be impactful,” Yun said. “Even a softer job market, if accompanied by falling inflationary pressure and lower mortgage rates, could be supportive, as home sales generally respond more favorably to lower rates.”
NAR releases home sales, housing market data
The following July data from the National Association of Realtors provides more insight into crucial housing market indicators.
- Total housing inventory: July inventory came in at 1.54 million units, which was down 1.9% from June and 0.6% from last July. This results in a 4.6-month inventory supply, which is flat since last month and last year.
- Median sales price: The median existing-home sale price was $434,100 for all home types (single-family housing, condos, and co-ops). This is a year-over-year increase of 2% — marking 37 straight months of price increases.
- Housing affordability: Affordability improved nationwide, with the largest growth in the West (7.3%) and the South (6.1%).
- Single-family home sales: Month-over-month single-family home sales decreased 1.9% in July to a seasonally adjusted rate of 3.69 million. Year-over-year sales increased by 0.8%.
- Condo and co-op sales: There was no monthly or annual change in the rate of condo or co-op sales in July. The seasonally adjusted annual rate was 370,000. The yearly median price increased by 2.2% to $371,800. Source: National Association of Realtors
Related: How the South became America’s biggest buyer’s market