The stock market has rallied sharply since President Donald Trump paused most reciprocal tariffs on April 9. The S&P 500 has gained nearly 20% over the period, which includes an impressive stretch of nine consecutive up days. The technology-heavy Nasdaq Composite has done even better, returning 24% since its early April lows.
The stock market’s reaction to President Trump’s tariff pause took many by surprise.
Stocks had sold off sharply in the preceding days after the President announced harsher-than-expected reciprocal tariffs, fueling inflationary and recessionary fears.
The speed and depth of the decline set the stage perfectly, though, driving most stocks, including the major indexes, into oversold territory.
Hope that cooler heads will prevail and more manageable tariffs will emerge, thanks to negotiations, proved the perfect catalyst for gains.
Yet, most of the reasons for the stock market’s decline remain. Now that the market has recouped the bulk of its losses since mid-February, further gains may be harder to come by, especially given one uncommon signal that recently flashed a warning.
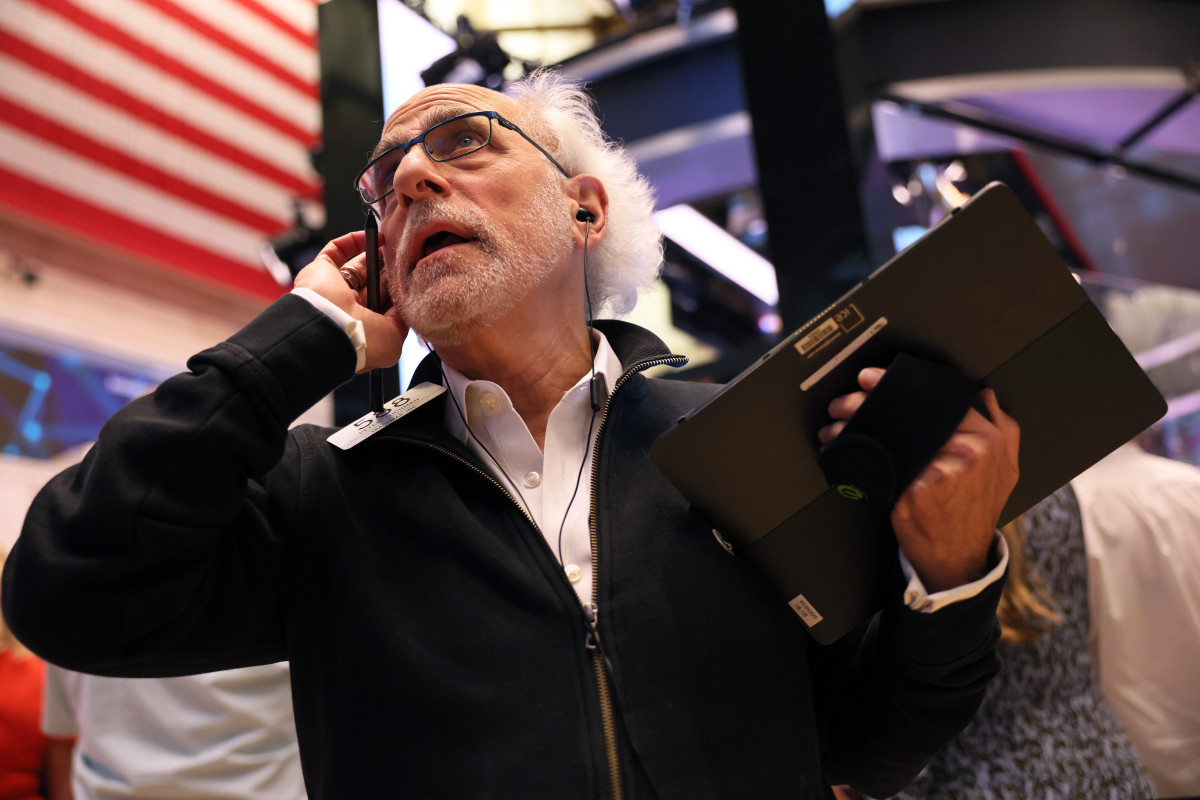 The S&P 500’s rally triggered an uncommon overbought signal.
Michael M. Santiago/Getty Images
The economy and the S&P 500’s valuation are headwinds
A decisive bull market drove the S&P 500 to back-to-back 20%-plus returns in 2023 and 2024, including an impressive 24% gain last year.
Those gains were largely built on optimism that the Federal Reserve would pivot from hawkish to dovish monetary policy as its focus shifted from battling inflation to supporting employment.
Related: Morgan Stanley reveals mid-year recession, interest rate cut forecast
Investors were also encouraged by a tsunami of spending on artificial intelligence as companies flocked to develop AI chatbots and agentic AI apps following the hugely successful launch of OpenAI’s ChatGPT in November 2022.
Unfortunately, those bullish tailwinds faded this year.
The Fed cut interest rates in September, November, and December, however it has since paused additional interest rate cuts over worry that inflation progress had stalled and could reexert itself because of tariffs. In April, the Consumer Price Index showed inflation at 2.3%, about in line with 2.4% last September, and above the Fed’s 2% target.
A sidelined Fed has removed some enthusiasm that lower rates would increase business investment and lower interest expenses on variable debt this year, hindering corporate sales and earnings growth, which historically drive stock prices higher.
AI spending growth could be near its peak. In January, the arrival of the Chinese-built Deepseek-R1, a rival to OpenAI’s ChatGPT and Google’s Gemini, surprised everyone because it had been developed for only $6 million using cheaper, legacy semiconductor chips, rather than Nvidia’s newest, fastest graphic processing units (GPUs).
To be sure, AI spending is expected to climb this year, but the pace of the growth is projected to slow, and macro worries could lead to the biggest spenders, including hyperscalers Amazon and Google, rethinking their data center plans.
Related: Secretary Bessent sends message on Walmart price increases due to tariffs
The Fed’s about-face, AI spending worries, and Trump’s Liberation Day tariffs announcement helped wipe much of the excess out of the stock market. However, now that stocks have recovered losses, they’re arguably pricey again.
The benchmark index is now trading at a forward price-to-earnings ratio of 21.4, above the 5-year average of 19.9 and the 10-year average of 18.3. In April, it had gotten to 19.4. Historically, the market’s one-year returns are negative when the forward S&P 500 P/E is between 20 and 22.
 The forward S&P 500 P/E ratio has risen since early April 2025.
Leon Cooperman/Doug Kass/TheStreet
The S&P 500 gets overbought as Treasury yields surge
At April’s lows, most sentiment measures were heavily oversold. For example, CNN’s Fear/Greed Index registered “Extreme Fear,” while the American Association of Individual Investors survey saw bearish outlooks for the coming six months surge to 61.9%, the third highest on record and the highest reading since the stock market’s March 2009 lows during the Great Financial Crisis.
Related: Billionaire Ray Dalio has strong reaction to US debt rating cut
Similarly, the volatility index, or VIX, had skyrocketed over 50 from near 20 before Liberation Day, and the CBOE’s put/call ratio, measuring bearish put to bullish call option activity, had reached 1.2, levels of fear coincident with relief rallies.
Those measures aren’t nearly as bullish now.
The Fear/Greed index is at “Greed.” AAII’s bearish responses have fallen to 44%, still high but not nearly as high as they were in April. Meanwhile, the VIX is back to 21, and the put/call ratio is below 0.90.
Overall, the sentiment signals that helped spark the S&P 500 and Nasdaq’s rally aren’t nearly as cooperative now as they were six weeks ago, something that’s also supported by another relatively uncommon signal, a relative strength index (RSI) (14) reading near 70.
RSI (14) measures price action over the preceding 14 trading periods and can signal when stocks become overbought and oversold. An RSI above 70 on the S&P 500 is a cautionary signal, while a reading below 30 suggests a rally may happen.
On May 15, the Nasdaq 100 ETF ( (QQQ) ) saw its RSI eclipse 70, while the S&P 500’s (SPY) RSI was over 69. That starkly contrasts RSIs in the low 20s near April’s low.
More Economic Analysis:
- Fed inflation gauge sets up stagflation risks as tariff policies bite
- U.S. recession risk leaps as GDP shrinks
- Like it or not, the bond market rules all
It’s also the highest RSI on the SPY since December 4 and on the QQQ since mid-December, which preceded losses through mid-January.
Of course, no signal is perfect, and stocks can rise and fall more than anyone thinks. They can also remain overbought and oversold for a while.
Still, the rise in the RSI readings is cautionary, suggesting the stock market could experience some backfilling of its recent gains as profit takers emerge, and worries over the economy resurface.
We may see that play out, given Moody’s surprising downgrade of U.S. debt on May 15 and the ensuing rally in Treasury yields.
The 10-year Treasury note yield hit 4.59% on May 21, up from below 4% on April 4. Meanwhile, the 30-year Treasury bond yield has increased to 5.08% from 4.39% over the same period.
Higher Treasury yields can signal decreased economic confidence. Since high yields make bonds more appealing, they can be a headwind to additional stock market gains.
Given that backdrop, the decline of the S&P 500 and Nasdaq Composites by 1.7% and 1.4% on May 21 may not be that surprising.
Related: Veteran fund manager unveils eye-popping S&P 500 forecast