
Wall Street analysts are currently projecting a bullish march for the S&P 500 in 2026, but buried within these rosy targets lies a hidden trap for SPY investors. Having navigated these markets for over 30 years, I’ve learned that when the consensus speaks in absolutes, history usually has a painful reminder waiting in the wings.
This year, the complacency is palpable. While the SPDR S&P 500 ETF (SPY) tracks an index at record highs, the “problem” isn’t the price but a disconnect most retail investors are completely overlooking.
One of the general truths I’ve learned in my investing career is that stocks tend to tip over when everyone is standing on the same side of the proverbial boat. They do much better when there’s a steady stream of people still on the other side trying to get across.
What worries me this year is that every Wall Street analyst has moved to the same side of the boat, and that’s potentially a big problem because it suggests there isn’t a lot of money still on the sidelines left to buy stocks.
Our own Charley Blaine surveyed the largest Wall Street research firms in December. The targets vary, but they share one thing in common. Every single analyst expects the S&P 500 to finish 2026 higher than it started.
That’s a contrast to last year, when Blaine’s survey showed a few firms still had bearish forecasts.
 Wall Street analysts predict a fourth consecutive year of S&P 500 gains in 2026.
Reuters
Stock market targets are overwhelmingly bullish
I read a lot of research reports, and one thing that stands out this year is that while most analysts point out rocky trends during mid-term election years (read more here), all of them expect any rockiness to be short-lived, with the S&P 500 delivering a fourth consecutive year of gains in 2026.
To be clear, that’s not a bad bet.
Mid-term years have the worst history of intrayear drawdowns of the four-year presidential cycle, falling an average of 18%. However, the damage is typically done in the second and third quarters of the year, with stocks finding their footing and rallying when election craziness is over.
Still, there are plenty of years when stocks finished the year lower.
“Midterm election year 2026 promises to be fraught with crisis, bear market action, and economic weakness,” notes Jeffrey Hirsch in the 2026 edition of the Stock Trader’s Almanac.
Since 1950, the average S&P 500 return in mid-term years is 4.6%, significantly below the 17.2% return notched in pre-election years and the 8% return in presidential election years. Performance has been worse since 1985.
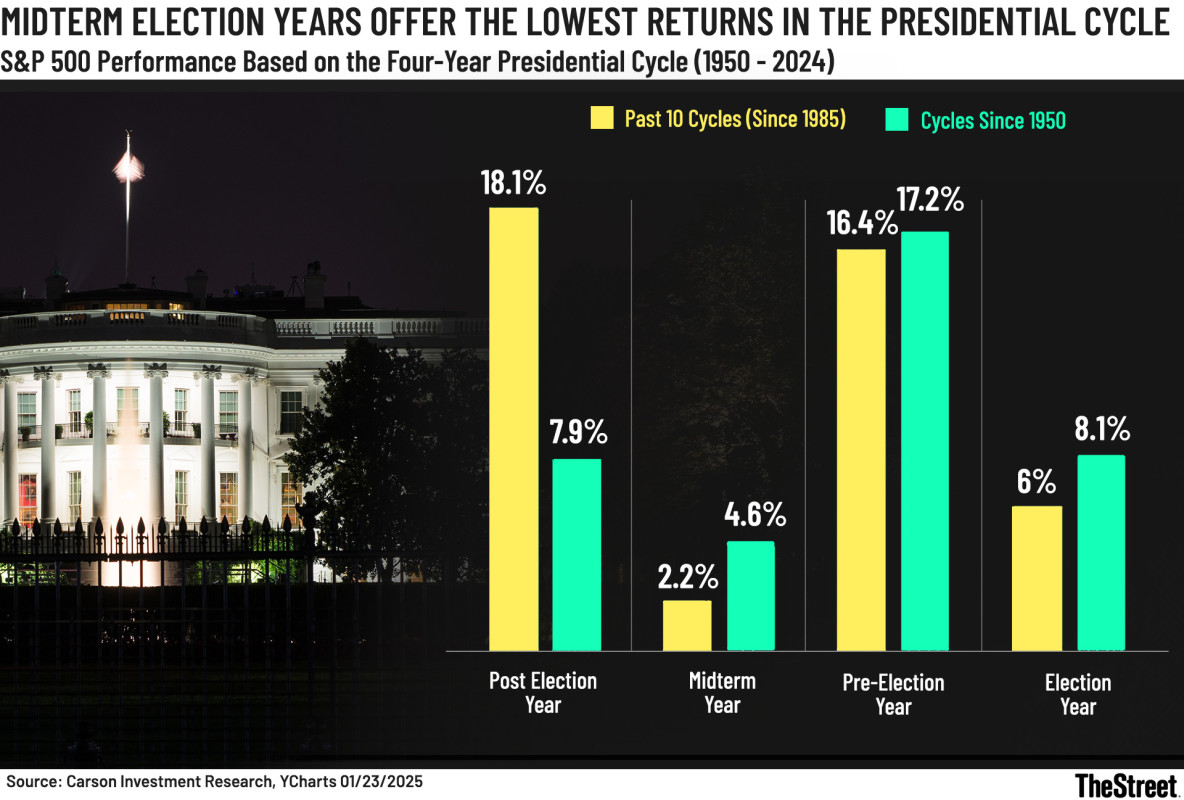 Midterm election years offer the lowest returns in the presidential cycle.
Carson Investment Research, YCharts, TheStreet
Overall, there have been nineteen presidential cycle mid-years, and 20% bear market drops have happened six times, including a 33.8% retreat in 2002 and a 25.4% drop in 2022.
Those were unique times, but you get the gist: Stocks aren’t guaranteed to deliver gains, even if everyone thinks that they will. Yet, Wall Street analysts remain firmly in the bull market camp.
Of the 21 analysts surveyed, 100% expect the S&P 500 to be up in 2026, including 10 who forecast double-digit returns.
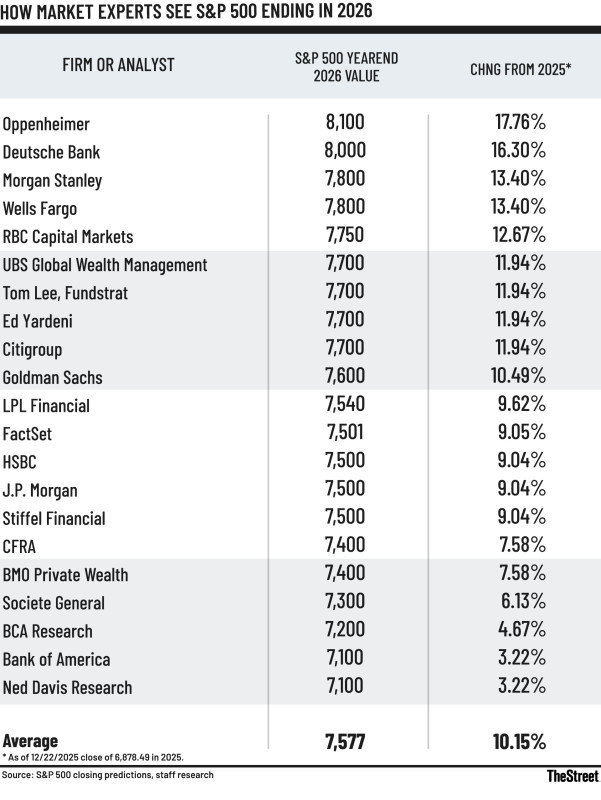 Wall Street analysts offer bullish forecasts for 2026.
S&P 500
It’s not just Wall Street that’s bullish and largely all-in. Every month, the American Association of Individual Investors (AAII) shares respondents’ allocation to stocks.
“As of the end of December, their allocation to stocks was fractionally over 70%,” wrote technical analyst Helene Meisler on TheStreet Pro.
Meisler points out that readings this high have only occurred four times in the past 20 years. Each time, the reading came within about one year of a substantial pullback, including in 2021 ahead of 2022’s bear market drop and in December 2024, before the near-bear market drop last spring.
My take on what investors can do now
Stocks go up and to the right over time, but they don’t do it in a straight line. They zigzag and take all sorts of detours that can keep investors awake at night. We certainly saw that last year, when the S&P 500 tumbled nearly 20% in the spring before rallying over 40% from April’s lows through year-end.
Unfortunately, nobody rings a bell signaling market tops or bottoms, but there are signals you can track to see if stocks get overbought or oversold.
TheStreet Pro’s Meisler has been tracking markets as a technical analyst since the 1980s, including a stint at Goldman Sachs. She watches the percentage of advancers to decliners over 10 days and 30 days, the Daily Sentiment Index, and other metrics for clues to when stocks may be overbought or oversold.
Related: Micron makes massive move as supercycle ramps
Those tools are best, however, for active traders. Main Street investors often struggle to time entry and exit points, making a buy-and-hold approach or subtle shifts more prudent.
Instead of reacting to media noise in the moment, most investors are best served by making adjustments on the margin rather than jumping in and out of stocks frequently, hoping to time things perfectly.
If, like me, you’re concerned that everyone is so bullish, minor adjustments could include normalizing the size of positions in your portfolio.
For example, if your normal position is 10% of your portfolio and something has grown to 20%, consider reducing it to 10% again to raise a little cash that you can put in a money market account while you wait to see if stocks do indeed retreat during their typical mid-year swoon.
Similarly, if you bought a stock that you no longer follow or if the catalyst for buying or owning no longer applies, reconsider if it’s the best name to own in your portfolio. If it isn’t, selling could help reduce your risk and give you a little more money on the sidelines to buy later in the year on a pullback.